
What the evidence shows
The four published amounts add up to £35 billion above existing spending plans in 2030/31. How much extra money is needed depends on what ministers choose to fund, what services cost and whether planned savings arrive.
- The example adds £11bn for defence, £9bn for health and other departments together, £4bn for pay and £11bn for savings falling short.
- £35bn is extra spending in one year. It is neither the total until 2030/31 nor an announced tax rise.
- We can check the rounded figures. We have asked for the detailed IFS spreadsheet to check the full calculation.
What would the extra money pay for?
Start with the budgets government departments use to run services and invest in buildings and equipment. The Institute for Fiscal Studies (IFS) asks how much more those budgets could need under one set of assumptions. Most benefits and interest on government debt sit outside this calculation.
| Choice or pressure in the IFS example | Extra | Running total |
|---|---|---|
| Increase defence from 2.7% to 3% of GDP | About £11bn | £11bn |
| Grow health spending 2.7% a year after inflation and protect other departments’ combined buying power | About £9bn | £20bn |
| Cover higher pay costs in the IFS example | About £4bn | £24bn |
| Cover the gap if only half the planned efficiency savings arrive | About £11bn | £35bn |
The table breaks down the extra money for 2030/31. For the defence target, GDP means the size of the economy: spending 3% of GDP means spending an amount equal to 3% of the economy.
The £9 billion covers two things together: growth in health spending and protection of other departments’ combined buying power. It is not £9 billion for health alone.
The four rounded amounts add up: £11bn + £9bn + £4bn + £11bn = £35bn. The pay and savings figures have already been adjusted to avoid counting some defence costs twice.
Pay and savings falling short make up £15 billion, about 43% of the example. These assumptions therefore matter a great deal. The calculation does not tell us how likely they are.
The £35 billion applies to the single financial year 2030/31. Earlier years could need different amounts, so multiplying £35 billion by the years remaining would give a misleading total.
Sources: Institute for Fiscal Studies
If the budget stays fixed, what happens to other services?
If health and defence receive more of a fixed overall budget, less is left for other departments. These separate IFS examples show the possible trade-off. They are not announced cuts.
To make the changes easier to compare, we start each group at 100 in 2027/28. A final score above 100 means the budget buys more by 2030/31; below 100 means it buys less.
In one example that gives health and defence more money within a fixed total, other departments lose 5.9% of their buying power over three years. Money that bought £100 worth of resources at the start buys roughly £94 worth at the end.
These are changes in buying power, not forecasts of appointments, lessons or court hearings lost. Individual services could receive different amounts. Results also depend on demand and how efficiently services use their resources.
The technical notes compare all three scenarios and explain why their starting budgets must be kept separate.
Sources: Institute for Fiscal Studies
Why a bigger cash budget may still buy less
A budget can grow in pounds but struggle to keep up with prices. When economists talk about spending after inflation, they mean what that money can buy.
Health-spending growth rates also differ depending on whether they include investment and which inflation forecast they use. The technical notes show the separate price calculation and explain the different health figures.
The plan also depends on services becoming more efficient
Better equipment, systems and organisation can help a service deliver more, or better, results with the resources it has. Economists call this productivity. It is about more than asking staff to work harder.
IFS estimates that the spending plans imply productivity growth of about 1.2% a year. The historical average was 0.2% from 1997 to 2019. That is a demanding improvement, but it does not prove the plans will fail.
These percentages are growth rates. They do not mean services become six times as productive. Nor would achieving half the planned savings automatically mean productivity growth of 0.6%. Prices and the mix of spending matter too.
There has been recent improvement. On 7 August 2026, the Office for National Statistics estimated that public-service productivity grew by 0.9% in 2025, revised up from 0.6%. Its level was still 2.5% below 2019.
The latest productivity estimate is uncertain and can change as more information arrives. One year of improvement does not establish that services can achieve the plan over several years.
Sources: Institute for Fiscal StudiesOffice for National Statistics
Why £35 billion is not the maximum possible cost
IFS also publishes a larger list of pressures in Table 6.2. Some rows overlap; others are alternative choices. Adding every row would produce a total that does not describe a single coherent plan.
The list does not put a price on social-care reform because that depends on the policy chosen. Costs for special educational needs and disabilities after 2028/29 are marked not estimated. Missing estimates do not mean zero cost.
Keep annual costs separate from deficits built up over several years. Both matter, but they cannot be treated as the same kind of number.
The technical notes explain why one table uses £12 billion for a pressure that contributes £11 billion to the headline example.
Sources: Institute for Fiscal Studies
Does this mean taxes must rise by £35 billion?
No particular tax rise follows from this example. Ministers could change other spending, borrowing, taxes or what services are expected to deliver. The calculation does not decide which choice is best.
The £35 billion cannot simply be subtracted from a headline borrowing-rule margin. The figures cover different years and treat some spending differently. The technical notes explain those differences.
Higher prices can bring in more cash tax while making fixed service budgets buy less. Meeting a borrowing rule therefore does not settle the choices about what services can provide.
Sources: Institute for Fiscal StudiesOffice for Budget ResponsibilityInstitute for Fiscal Studies
What the next Budget could tell us
The Budget is scheduled for 28 October 2026. New plans and forecasts could show whether departmental budgets rise, which defence commitments are funded and how much still depends on savings.
We will look separately at running costs, investment and the money left for services outside the largest priorities. Changes caused by new policies should also be distinguished from changes in the economy.
The useful question is not only whether £35 billion appears in a headline. It is which choices and costs the government decides to cover.
What we still need to know
Checked: the published rounded components add to £35 billion. We also repeated the separate buying-power and price calculations explained here.
Still unclear: we do not have the unrounded IFS spreadsheet or the exact adjustments for costs that overlap. Matching the rounded total does not reproduce the full model.
Next update: we asked IFS for the spreadsheet and clarification on 12 October 2026. A reply is not guaranteed. A saved reminder will check for the Budget and official forecasts on 28 October. Any new evidence must be reviewed before an article or carousel update.
Technical notes: the three buying-power scenarios
Each scenario starts from its own budget of 100. The third changes health spending in earlier years too. Do not compare the final scores as if they were amounts of money from the same starting budget.
Scroll across to see all columns
| Separate allocation scenario | Health | Defence | Other departments combined |
|---|---|---|---|
| Health growth 2.7%; defence stays at 2.7% of GDP | 108.3 | 104.9 | 97.3 |
| Health growth 2.7%; defence reaches 3% of GDP | 108.3 | 118.4 | 94.1 |
| Health growth 1.5%; defence reaches 3% of GDP | 104.6 | 118.4 | 97.3 |
For anyone repeating the calculation: we apply the published average annual rates three times, using the March 2026 inflation assumptions in IFS Figure 6.10. This is our illustration from rounded rates, not a reconstruction of every year’s budget.
In this table, health means the Department of Health and Social Care. Defence includes the Ministry of Defence and the Single Intelligence Account. Other departments excludes grants to devolved governments and the Treasury Reserve.
Sources: Institute for Fiscal Studies
Technical notes: the price calculation and different health figures
Here is a separate illustration for 2024/25 to 2028/29. Suppose a cash budget was set to buy 100 units of resources after an expected price rise of 8.5%. If prices instead rise by 12.1%, the same money buys 96.8 units: 100 × 1.085 ÷ 1.121 = 96.8.
That is a 3.2% loss of buying power. Simply subtracting the inflation percentages gives 3.6 percentage points, which answers a different question.
This illustration is not an estimate for every department. Services buy different things, pay is considered separately, and the two price forecasts are alternatives rather than a statistical range of likely outcomes.
The original Treasury health settlement also needs careful reading. Its cash totals rise from £215.6 billion in 2025/26 to £246.7 billion in 2028/29. Table 5.6 reports 2.7% average annual growth after inflation, using adjustments that the cash totals alone cannot reproduce.
A later IFS figure of 2.5% covers day-to-day health spending instead of the total. It also uses a different inflation forecast. Those two rates describe different calculations.
Technical notes: uncertainty in productivity estimates
The estimate is uncertain: the ONS 95% interval for annual growth ran from -1.3% to 3.2%. These developing statistics can change as more information arrives. One year does not settle whether a plan covering several years will work.
The detailed figures are in Tables 1 and 3 of the January to March 2026 release. NHS England and ONS healthcare measures cover different services and places, so they cannot be substituted for one another.
Sources: Institute for Fiscal StudiesOffice for National Statistics
Technical notes: overlapping costs and coverage
For example, IFS Table 6.2 gives £12 billion for its standalone productivity pressure. Figure 6.11 uses £11 billion after adjusting for overlap. Substituting 12 in our four-part sum would produce £36 billion instead of the published £35 billion.
Coverage also changes: Table 6.2 includes spending for devolved governments that some earlier figures exclude. That helps explain differences without implying money has gone missing.
Sources: Institute for Fiscal Studies
Technical notes: borrowing rules and the separate headroom estimate
The £35 billion also cannot simply be subtracted from a headline figure for fiscal headroom. Headroom is how far a forecast sits inside a government borrowing rule. It is not money in a bank account.
One reason is that the departmental total includes running costs and investment. The current-budget rule treats investment separately, although it includes depreciation, the cost of assets wearing out. Investment borrowing still has costs and other limits.
Another reason is timing. A separate IFS assessment suggests roughly £20 billion of headroom in 2029/30 under one plausible set of assumptions before new policy decisions. That uncertain estimate and this spending example for 2030/31 answer different questions.
Sources: Institute for Fiscal StudiesOffice for Budget ResponsibilityInstitute for Fiscal Studies
What is established
- The rounded amounts in IFS Figure 6.11 add to £35bn for 2030/31 in the stated example.
- Our separate buying-power and price examples use the published rounded inputs.
- We sent the IFS enquiry on 12 October 2026. The Budget availability check is saved for 28 October.
What remains unknown
- We still need the unrounded IFS model and the exact adjustments for overlapping costs.
- These examples do not tell us how likely a tax rise, spending cut, funding choice or change in services is.
The story, in order
Spending Review settlement
Treasury publishes departmental plans and the health settlement used as background.
March forecast
OBR forecast supplies the economic and fiscal background; keep its vintage distinct from later assumptions.
Productivity update
ONS publishes the January to March release, including revised 2025 growth and uncertainty.
IFS example checked
Published rounded components and separate buying-power calculations checked. Detailed workbook requested.
Next saved availability check
Future Budget date. Availability check only; no result or update is assumed in advance.
YOUR TURN TO CHECK
Reproduce this investigation
Repeat the published-number checks, then see exactly where the available data stops.
You will need
A browser and Excel, another spreadsheet app, or Python 3 for the optional calculation script
What you can and cannot repeat
These files contain our factual transcription and arithmetic from published rounded inputs. They contain neither the unrounded IFS workbook nor the original IFS chart artwork, private correspondence or individual departmental model. Matching the rounded total is not a full replication.
Open the original figure
Open the IFS chapter and find Figure 6.11 and its accompanying notes. Confirm that the amounts refer to extra departmental spending in 2030/31.
Keep in mind Use the adjusted figure components, not a sum of all rows in Table 6.2.
Download the working files
Download the rounded components CSV and growth-rate CSV below. The files keep the amount, period, units, source and limits beside each input. Our labels explain the source in our own words.
Rebuild the £35 billion total
Add the four adjusted components in the components file. The £9bn combines health growth with protecting other departments’ combined buying power.
11 + 9 + 4 + 11 = 35Keep in mind The separate Table 6.2 productivity row is £12bn. Figure 6.11 uses £11bn after an overlap adjustment; substituting 12 would produce 36.
Repeat the buying-power examples
In the growth file, each scenario starts at 100 in 2027/28. Apply its annual real growth rate three times to reach 2030/31.
100 × (1 + annual rate / 100)^3Keep in mind For the second scenario, other departments: 100 × 0.98^3 = 94.1192. These are aggregate buying-power examples, not equal cuts or service-output forecasts.
Keep the starting points separate
Each example starts from its own budget, shown as 100. The slower-health-growth example also changes earlier spending. Compare percentage changes within each example, not the final scores as if they were equal amounts of cash.
Keep in mind Other departments excludes devolved block grants and the Treasury Reserve. Check the Figure 6.10 notes for boundaries.
Repeat the price illustration
Use the original expected price factor 1.085 and alternative factor 1.121 from the separate inflation illustration. Divide rather than subtract percentages.
100 × 1.085 / 1.121 = 96.7886Keep in mind The approximately 3.2% loss applies to this fixed-cash illustration, not to every department.
Check what each number measures and when it was published
Read Treasury Table 5.6, OBR Chapter 5 and ONS Tables 1 and 3. Keep cash amounts separate from buying power, running costs separate from investment, and forecasts from different dates separate.
Run the script and retain the limits
The recalculation ZIP contains the same CSV inputs, a plain Python calculation and expected results. Run python calculate.py in its extracted folder, or use the formulas above in Excel.
Keep in mind The IFS workbook has been requested. The next saved availability check is 28 October 2026; no automatic analysis or publication is promised.
Sources you can check
- Public service spending: plans and pressuresInstitute for Fiscal Studies / 12 October 2026Figure 6.11 rounded components and overlap notes; Figure 6.10 growth rates; Figures 6.6 and 6.9 and Tables 6.1 and 6.2 for context
- Spending Review 2025, Table 5.6HM Treasury / 11 June 2025Original cash health settlement and adjusted published real-growth rate
- Public service productivity, quarterly, UK: January to March 2026Office for National Statistics / 7 August 2026Tables 1 and 3, revision and uncertainty in public-service productivity
- Economic and fiscal outlook: March 2026Office for Budget Responsibility / 3 March 2026Chapter 5 fiscal tests; supporting spending definitions and forecast assumptions
- Spending pressures, not fiscal headroom, are the Chancellor’s key Budget challengeInstitute for Fiscal Studies / 12 October 2026Separate pre-policy fiscal assessment and its uncertainty
- Budget date confirmationHM TreasuryConfirms 28 October 2026 Budget date
Research checked 12 October 2026. This is our explanation and arithmetic using attributed published inputs. We have not independently repeated the complete IFS model. Original research and source extracts are kept privately. The public downloads contain selected factual inputs and our calculations.
Inspect the evidence
Source notes include the links and verification limits. The timeline opens in Excel or any spreadsheet app.
Photo credit and licence
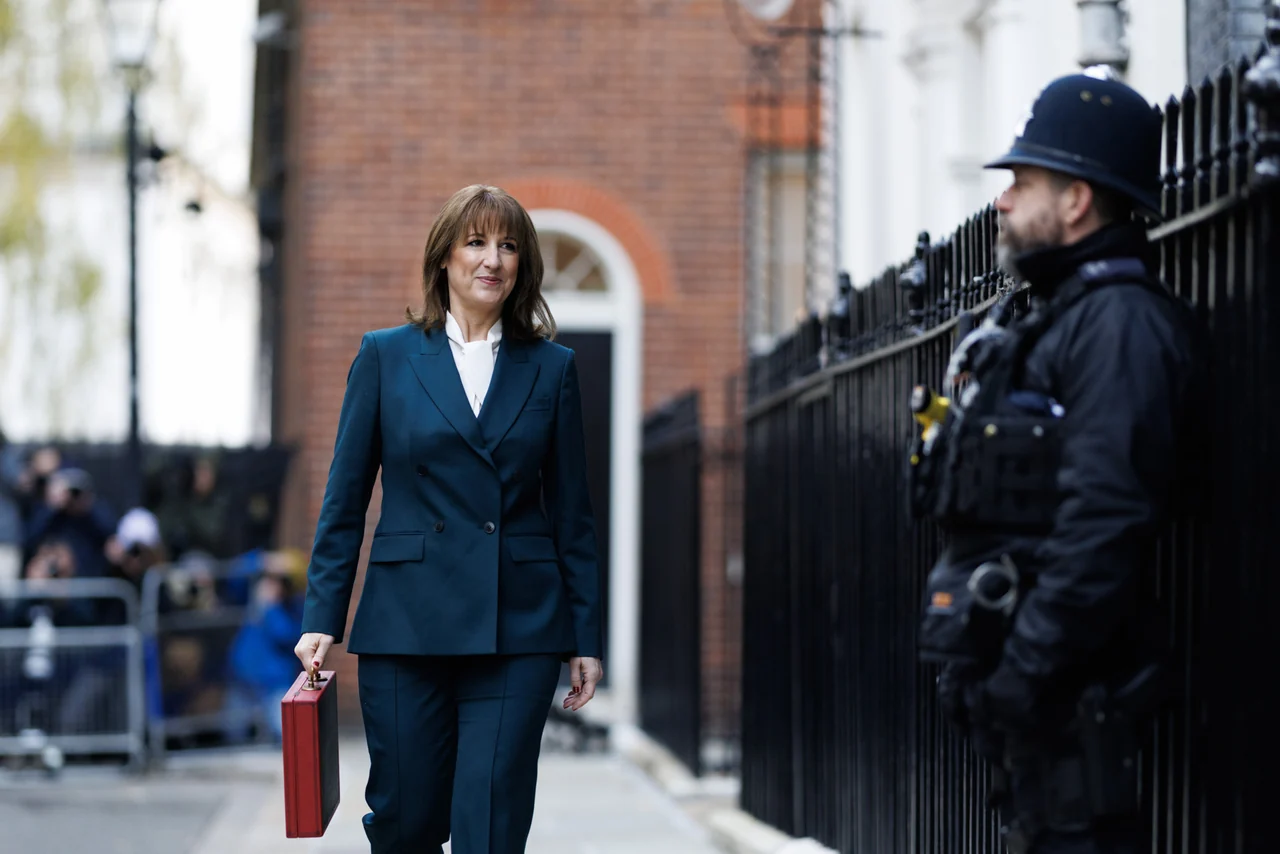
Rachel Reeves with the Budget box outside 11 Downing Street, 26 November 2025. Simon Dawson / No 10 Downing Street, Crown copyright. CC BY 4.0. Resized and compressed for display; CSS crop. Homepage dark gradient and text overlay. No documentary content alteration or endorsement.
Carousel photograph credits and licences
- Chancellor Rachel Reeves prepares to deliver the Budget (54947859269).jpg
Simon Dawson / No 10 Downing Street, Crown copyright. Archive photograph taken 26 November 2025 of Rachel Reeves walking outside 11 Downing Street with a red Budget box; this is context for budget choices, not an image of the forthcoming October 2026 Budget
CC BY 4.0. Cropped, resized and darkened for the carousel. - HM Treasury east entrance.jpg
JamesF. Archive of the east entrance of HM Treasury in London, photographed by JamesF on 7 April 2004; institutional context for departmental budget plans
CC BY-SA 3.0. Cropped, resized and darkened for the carousel. Original and photographic adaptation under CC BY-SA 3.0. - HMS Queen Elizabeth, Portsmouth - 2023-04-22 (1).jpg
The wub. HMS Queen Elizabeth moored in Portsmouth on 22 April 2023, an archive defence-capability context photograph by The wub
CC BY-SA 4.0. Cropped, resized and darkened for the carousel. Original and photographic adaptation under CC BY-SA 4.0. - Finchley Memorial Hospital, London N12, 2025-10-09.jpg
Mike Lidgley. Black-and-white archive photograph of a mobile NHS MRI scanning unit outside Finchley Memorial Hospital on 9 October 2025, by Mike Lidgley; health equipment context, with no patients depicted
CC0. Cropped, resized and darkened for the carousel. - London UK, August 17 2026, Council Ten Wheel Refuse Collection Truck Driving On Public Road
Richard M Lee / Shutterstock.com. A council refuse truck carrying a raised red wheeled bin on a UK public road, photographed by Richard M Lee and dated 17 August 2026 by Shutterstock; illustrative public-service context, not evidence of this council costs or efficiency
Shutterstock Standard, Editorial Use Only. Cropped, resized and darkened for the carousel. - House of Commons 2010.jpg
UK Government, Crown copyright. Archive photograph of the UK House of Commons chamber in 2010, used as context for parliamentary funding choices rather than any current debate or vote
OGL 3. Cropped, resized and darkened for the carousel. - A Calculator and Documents on the Table
Mikhail Nilov. Illustrative photograph of a calculator and files on a desk by Mikhail Nilov, taken in 2021; it does not show the IFS workbook or the actual enquiry
Pexels License. Cropped, resized and darkened for the carousel.
These credits cover the carousel photographs. Original stock files are not distributed here. The logo remains separate brand artwork.
Research and production assisted by AI. Read our approach
Have evidence that could change this finding? Contact TALLYCAT01