
The finding
The report’s 57% rise runs from 2023 to 2025. Yusuf’s caption calls it a rise on the previous year. The report gives about 25% for the one-year comparison, but two source tables disagree about spending during the same months. We need that difference explained before treating 25% as a fully checked annual trend.
- £11.920bn rounds to £12bn for the defined household payments in 2025.
- The 57% comparison covers two years, not one.
- Household spending cannot all be assigned to foreign individuals.
- The Misinformation Claim label applies to the wrong comparison period. It does not establish intent.
The post puts the rise in the wrong year
On 20 September 2026, Zia Yusuf shared a newspaper headline saying migrant households had received £12 billion in Universal Credit during the previous year.
His caption added: “That is an increase of 57% on the year before”. That makes the increase a one-year change.
The September report from the Centre for Migration Control (CMC), associated with the story, instead compares 2025 with 2023 for its 57% figure. This is the period error our Misinformation Claim label addresses. Yusuf’s wider political arguments are separate from this check.
Sources: Zia Yusuf on InstagramCharles Hymas / The Telegraph, lawfully syndicated by AOL
The starting year changes the answer
The CMC report gives £11.920 billion for 2025 and a reported £7.6 billion for 2023. The increase between those amounts is 56.8%, which rounds to 57%.
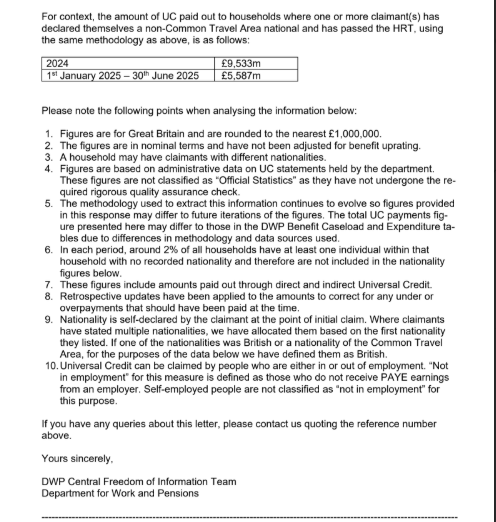
For 2024, the report gives £9.533 billion. Comparing that with £11.920 billion in 2025 produces about 25%. We recovered the earlier response pages containing the 2024 amount. Rounding to the nearest £1 million cannot explain the gap between 25% and 57%.
There is a limit to this comparison: the older and newer responses give different totals for some of the same months in 2025. We explain the discrepancy below. For that reason, about 25% is the comparison in the report, not a fully reconciled official measure of annual growth.
Sources: Centre for Migration Control; reproduced Department for Work and Pensions responseDWP response reproduced by Centre for Migration Control
Scroll across to see all columns
| Comparison | Starting amount | 2025 amount | Calculated rise | Period |
|---|---|---|---|---|
| 2024 to 2025 | £9.533bn | £11.920bn | 25.0% | One year |
| 2023 to 2025 | £7.6bn | £11.920bn | 56.8%, rounded to 57% | Two years |
Who is included in the £12 billion?
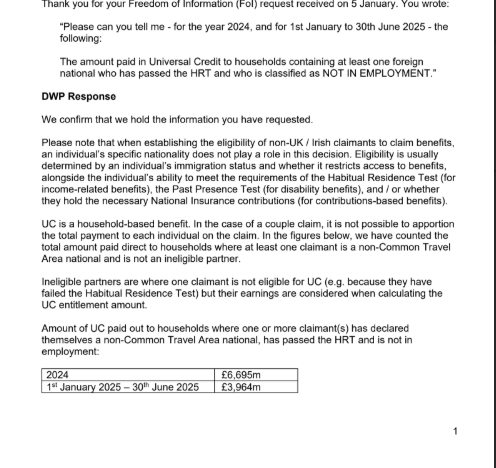
The later response from the Department for Work and Pensions (DWP) gives £11,920 million for January to December 2025 in Great Britain. That rounds normally to £12 billion. The evidence does not establish a UK total including Northern Ireland.
DWP selected these payments using nationality records that excluded British and Irish nationality. It then counted the whole Universal Credit payment for each qualifying household, without dividing it between individual family members. This is a particular statistical group, not a count of every migrant household.
Here, a household award means a Universal Credit claim for a single person or a couple, including support for dependent children where applicable. It does not mean everyone living at the same address.
A payment can therefore support an eligible British partner or children too. The £12 billion is not money shown to have gone exclusively to foreign individuals. Nor is it an estimate of fraud or migration’s overall cost after tax contributions are considered.
The nationality records are self-reported and may not immediately reflect someone becoming British. The source is a DWP response reproduced by CMC, not a response obtained directly by TALLYCAT01.
Sources: Centre for Migration Control; reproduced Department for Work and Pensions responseDepartment for Work and Pensions / UK Parliament
Why we cannot treat every figure as directly comparable
The earlier response gives £5.587 billion for January to June 2025. Adding the same six months in the later response gives £5.861 billion. That is £274 million more, or about 4.9%, for the same period.
The difference is too large to explain by rounding alone. We do not know whether it comes from revised payments, nationality records, changes in how the data were selected, or another reason.
DWP would need to explain the difference or supply the annual totals using one consistent method. Until then, the narrow correction remains sound: the report attaches 57% to two years, while Yusuf attaches it to the previous year.
Sources: Centre for Migration Control; reproduced Department for Work and Pensions responseDWP response reproduced by Centre for Migration ControlDWP response reproduced by Centre for Migration Control
The £7.7 billion figure also describes household payments
The later table puts £7.669 billion in its not-in-work category, rounded to £7.7 billion. Yusuf’s caption describes households with at least one person out of work. That qualification is more careful than the shared image’s wording about “jobless foreign nationals”.
DWP says it cannot split joint payments between individual claimants. The table therefore does not show that all £7.7 billion went exclusively to foreign people without jobs, or that nobody in the included households worked.
The table’s in-work and not-in-work groups overlap. They are not two separate slices that can be added into a pie chart. The share of money spent is also different from the share of people receiving it.
Universal Credit can support low-paid workers and people with health, caring or childcare circumstances. These totals alone cannot tell us why an individual receives it.
Sources: Zia Yusuf on InstagramCentre for Migration Control; reproduced Department for Work and Pensions responseDepartment for Work and Pensions / UK ParliamentDepartment for Work and Pensions
A rise in spending does not explain what caused it
Spending can change because of arrivals, benefit rates, earnings, family circumstances or people moving onto Universal Credit from older benefits. These tables do not separate the contribution of each cause.
DWP says transfers from older benefits account for 78.3% of the overall rise in Universal Credit claimant numbers between December 2023 and December 2025.
That is a count of people across the wider system. It does not mean transfers explain 78.3% of this nationality group’s spending rise. The table also does not match these payments with tax paid or other public costs, so it cannot show the overall effect on government finances.
Sources: Centre for Migration Control; reproduced Department for Work and Pensions responseDepartment for Work and Pensions
What we still need to know
Checked: the rounded £12 billion amount and the report’s two-year 57% comparison. The recovered 2024 response also supports the report’s approximate 25% calculation, subject to the data differences above.
Still unclear: why the responses disagree for the same months, whether all years were selected consistently, which report version Yusuf saw and whether his wrong period was deliberate. The original response behind the reported 2023 figure has not been recovered.
What would help: DWP totals for 2023, 2024 and 2025 produced using one consistent method, an explanation of revisions, and the complete earlier response with its reference and date.
The broader annual-trend investigation is on hold. No clarification request has been sent and no response deadline is running. A routine Universal Credit release would not automatically supply this missing comparison.
Sources: Centre for Migration Control; reproduced Department for Work and Pensions responseDWP response reproduced by Centre for Migration ControlDepartment for Work and Pensions
Technical notes: why self-employment does not explain the data gap
Both responses exclude self-employed people from their not-in-work category. We therefore cannot claim that a changed treatment of self-employment explains the discrepancy.
Sources: Centre for Migration Control; reproduced Department for Work and Pensions responseDWP response reproduced by Centre for Migration ControlDWP response reproduced by Centre for Migration Control
What is established
- The defined 2025 household payments total £11.920bn, which rounds to £12bn.
- The report’s 57% comparison runs from 2023 to 2025.
- The earlier response pages contain £9.533bn for 2024.
- The two response versions differ by £274m for January to June 2025.
What remains unknown
- Annual totals for all years produced using one consistent method.
- Why the same six months have different totals in the two responses.
- Which report version Yusuf saw and whether he corrected his wording elsewhere.
- Whether the period error was intentional.
The story, in order
Earlier response published
CMC’s February article links the recovered response pages with the 2024 total. The response header and issue date are cropped.
Later DWP response dated
FOI2026/83815 covers calendar 2025 and appears in CMC’s September report.
The selected Instagram post
Yusuf’s caption describes 57% as an increase on the previous year.
TALLYCAT01 evidence check
The post, response reproductions and arithmetic are reviewed. No publication or outreach is implied.
YOUR TURN TO CHECK
Reproduce this investigation
Follow the original wording, identify the years being compared and repeat the arithmetic. Then check the discrepancy that limits how confidently the response versions can be combined.
You will need
A browser and a calculator, or Excel or another spreadsheet app. The optional Python file requires Python 3 and no extra libraries.
What you can and cannot repeat
These steps repeat published figures, not an analysis of individual claimants. We have not recovered the original 2023 response. The older response pages have cropped headers, and both reproductions are hosted by the requester. They disagree on the first half of 2025, so the annual figures are not yet a fully reconciled series. If you cannot access the post or article, record that you could not repeat that step.
Record the exact claim
Open the original Instagram post. Separate the caption from the image. Write down the sentence assigning 57% to “the year before”, and note that the £7.7bn sentence in the caption describes households.
Keep in mind An inaccessible post cannot be treated as independently inspected. Our preserved check recorded publication on 20 September 2026.
Find the comparison periods
Open the September PDF at pages 2 and 3. Find the comparisons with 2023 and 2024. Record the year beside each percentage before looking at the size of the number.
Keep in mind The report’s 57% period is two years. Its approximately 25% comparison uses the previous year.
Verify the household spending cells
In the same PDF, inspect page 8 for the 2025 total and pages 7, 10 and 11 for overlap and definitions. Then open the older response’s second image and find £9,533m for 2024.
Keep in mind These are DWP response reproductions hosted by the requester. Preserve the older page’s missing header and date limitations.
Calculate the one-year comparison
Download the published-inputs CSV. Keep the rows whose input_id values are annual_2024_older_response and annual_2025_september_response. Both are in £m. Divide 11,920 by 9,533, subtract 1 and multiply by 100. Expect 25.0393%, usually displayed as 25.0%.
=(11920/9533-1)*100Keep in mind This repeats the published-version comparison. It does not remove the extraction discrepancy checked below.
Calculate the comparison that produces 57%
Keep the annual_2023_cmc_reported and annual_2025_september_response rows. Divide 11,920 by 7,600, subtract 1 and multiply by 100. Expect 56.8421%, rounded to 57%. The years are 2023 and 2025.
=(11920/7600-1)*100Keep in mind The £7.6bn input is reported by CMC. Its original 2023 response was not recovered, so this reproduces the report’s arithmetic rather than authenticating that original response.
Check the same-period discrepancy
Compare £5,587m for January to June 2025 in the older second page with £5,861m obtained by adding the six months in the later table. Subtract the earlier total. Expect £274m. Divide by £5,587m for about 4.9%.
5861-5587 = 274 million pounds =(5861/5587-1)*100 = approximately 4.9%Keep in mind Rounding alone is too small to explain the difference. The cause is not established. Do not silently merge these versions into a matched trend.
Keep households separate from individuals
Read the official parliamentary answer and the later PDF’s notes. Check what the source says about joint awards, individual allocation and overlapping work categories. Compare that with the image and with the more qualified caption.
Keep in mind The precise later nationality/work-status join is not supplied. Do not invent which household member must be out of work.
Write the narrow conclusion
Keep three conclusions separate: £12bn is supported as a rounded household-spending total; the report’s 57% comparison covers two years; the exact one-year trend still needs consistent source data. Neither intent nor the reasons spending changed are established.
Keep in mind No matched tax data, all-benefits total or causal decomposition is provided by this spending table.
Sources you can check
- Original Instagram postZia Yusuf on Instagram / 20 September 2026Exact caption, shared image and displayed publication time
- September report including reproduced DWP response FOI2026/83815Centre for Migration Control; reproduced Department for Work and Pensions response / 17 September 2026CMC comparison on PDF pages 2 and 3; DWP expenditure and definitions on PDF pages 6 to 11
- February article carrying the earlier DWP response imagesCentre for Migration Control / Migration Central / 19 February 2026Publication context for the recovered 2024 response pages
- Earlier DWP response page 1DWP response reproduced by Centre for Migration ControlEmployment subtotal and earlier response wording
- Earlier DWP response page 2DWP response reproduced by Centre for Migration ControlOverall 2024 total, January to June 2025 total and methodology notes
- Migrant households receive record £12bn in universal creditCharles Hymas / The Telegraph, lawfully syndicated by AOL / 20 September 2026Matching headline and reporting of roughly a quarter increase against 2024
- Written parliamentary answer 74001Department for Work and Pensions / UK Parliament / 10 September 2025Official explanation of joint awards and inability to apportion payments to individual claimants
- Universal Credit statistics: background information and methodologyDepartment for Work and Pensions / 18 August 2026Official definitions and statistical limitations
- Universal Credit quarterly statistics to 14 May 2026Department for Work and Pensions / 18 August 2026Context about legacy-benefit transfers and routine release schedule
We inspected and preserved the rendered Instagram post, requester-hosted DWP reproductions, relevant official context and the actual page images. We recalculated published numerical cells and compared response versions. This is not individual-level analysis or a DWP response obtained directly by TALLYCAT01.
Inspect the evidence
Source notes include the links and verification limits. The timeline opens in Excel or any spreadsheet app.
Photo credit and licence
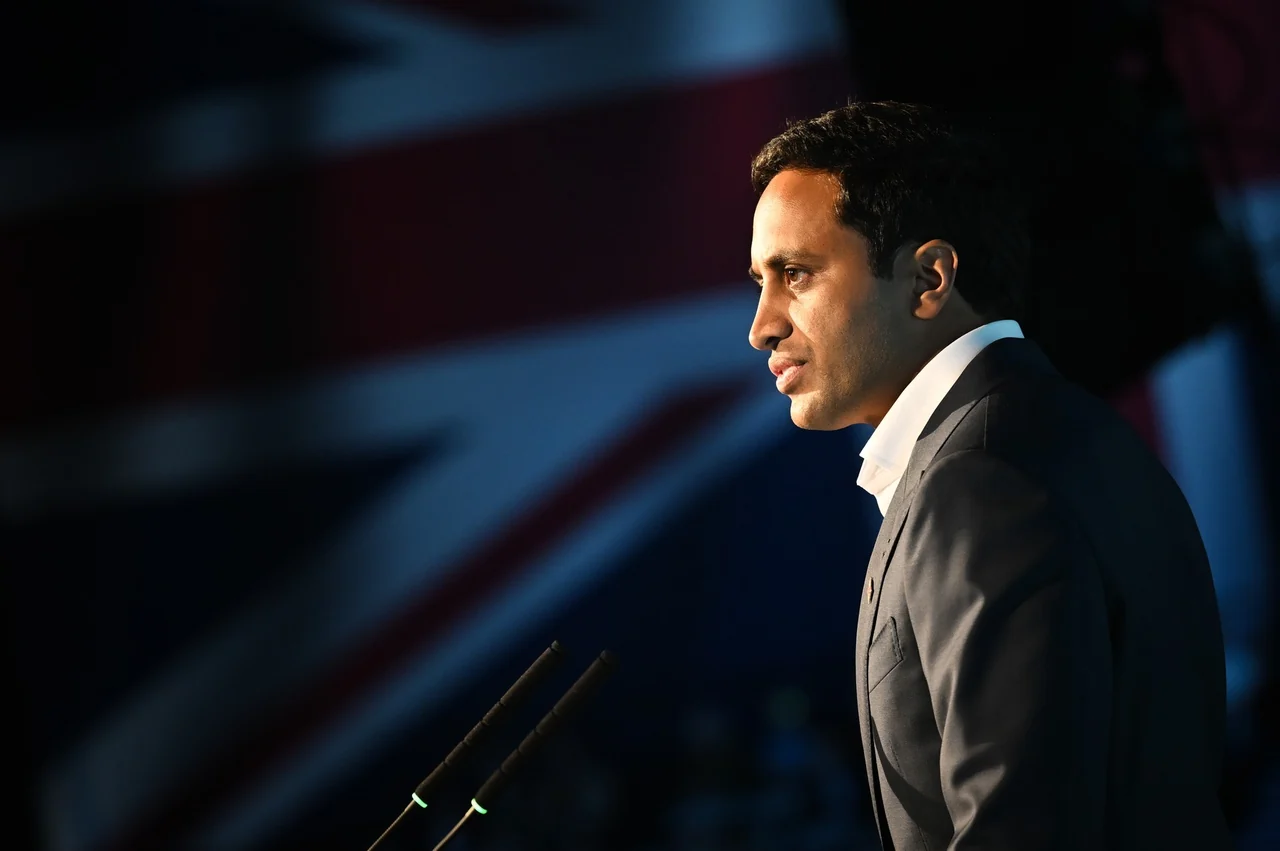
Zia Yusuf addresses Reform UK, Birmingham NEC, 30 June 2024. Z979 / Wikimedia Commons. CC0 1.0. Resized for display and cropped to fit. Homepage photographs also have a dark gradient and text overlay.

Carousel photograph credits and licences
- Zia Yusuf at the Birmingham NEC, June 2024
Z979. An authentic archive photograph of Yusuf speaking on 30 June 2024. It does not show the selected September 2026 post or establish intent.
CC0 1.0 public domain dedication. Cropped, resized and darkened for the carousel. - Photographed smartphone with app icons
cottonbro studio. A photographed process illustration of anonymous hands using a smartphone. It is not Yusuf’s phone or the selected post.
Pexels License. Cropped, resized and darkened for the carousel. - Photographed 2025 desk calendar
Matheus Bertelli. A photographed calendar illustrating comparison periods. Its Portuguese month labels are not a representation of a DWP accounting document.
Pexels License. Cropped, resized and darkened for the carousel. - Calculator and documents on a desk
Mikhail Nilov. A photographed calculation illustration. The objects are not the DWP response or original case data.
Pexels License. Cropped, resized and darkened for the carousel. - Miniature house and keys
Atlantic Ambience. A photographed household metaphor. It does not depict a recipient, a real claimant household, nationality or the allocation of Universal Credit to housing alone.
Pexels License. Cropped, resized and darkened for the carousel. - Jobcentre Plus in Staines, July 2025
DanielMichaelPerry. An authentic location photograph from 7 July 2025. It does not show the source data, establish who made the wrong comparison or imply a DWP endorsement.
CC0 1.0 public domain dedication. Cropped, resized and darkened for the carousel.

These credits cover the carousel photographs. Original stock files are not distributed here. The logo remains separate brand artwork.
Research and production assisted by AI. Read our approach
Have evidence that could change this finding? Contact TALLYCAT01